

On AI and startups
I Open-Sourced the Growth Dashboard I Built From 29 Data Sources
TL;DR
- As of August 2026, Sameer Ahmed Khan has open-sourced the SaaS growth dashboard he built for Social Champ at github.com/SameerKhan/saas-growth-dashboard under the MIT licence.
- The engine ships 29 source connectors, from GA4 and Google Ads to ChartMogul, Amplitude, Ahrefs, MongoDB, Stripe billing and Reddit, and folds them into 36 modeled views.
- Everything lands in BigQuery, which costs most SaaS companies between $0 and $5 a month at this volume, and renders to one HTML page instead of eight browser tabs.
- It runs through MCP, so Claude Code, Codex or Cursor can query the whole business by asking for the daily report in plain language.
Every morning for years, the first thing I did was open eight tabs. GA4 for traffic. ChartMogul for revenue. Amplitude for activation. Ahrefs for rankings. ClickUp for what the team shipped. Crisp for what customers were angry about. By the time I had all of them loaded I had forgotten what question I sat down to answer.
The dashboard started because I got tired of that. It ended up being the most useful thing I have built for myself in years, so I put it on GitHub.
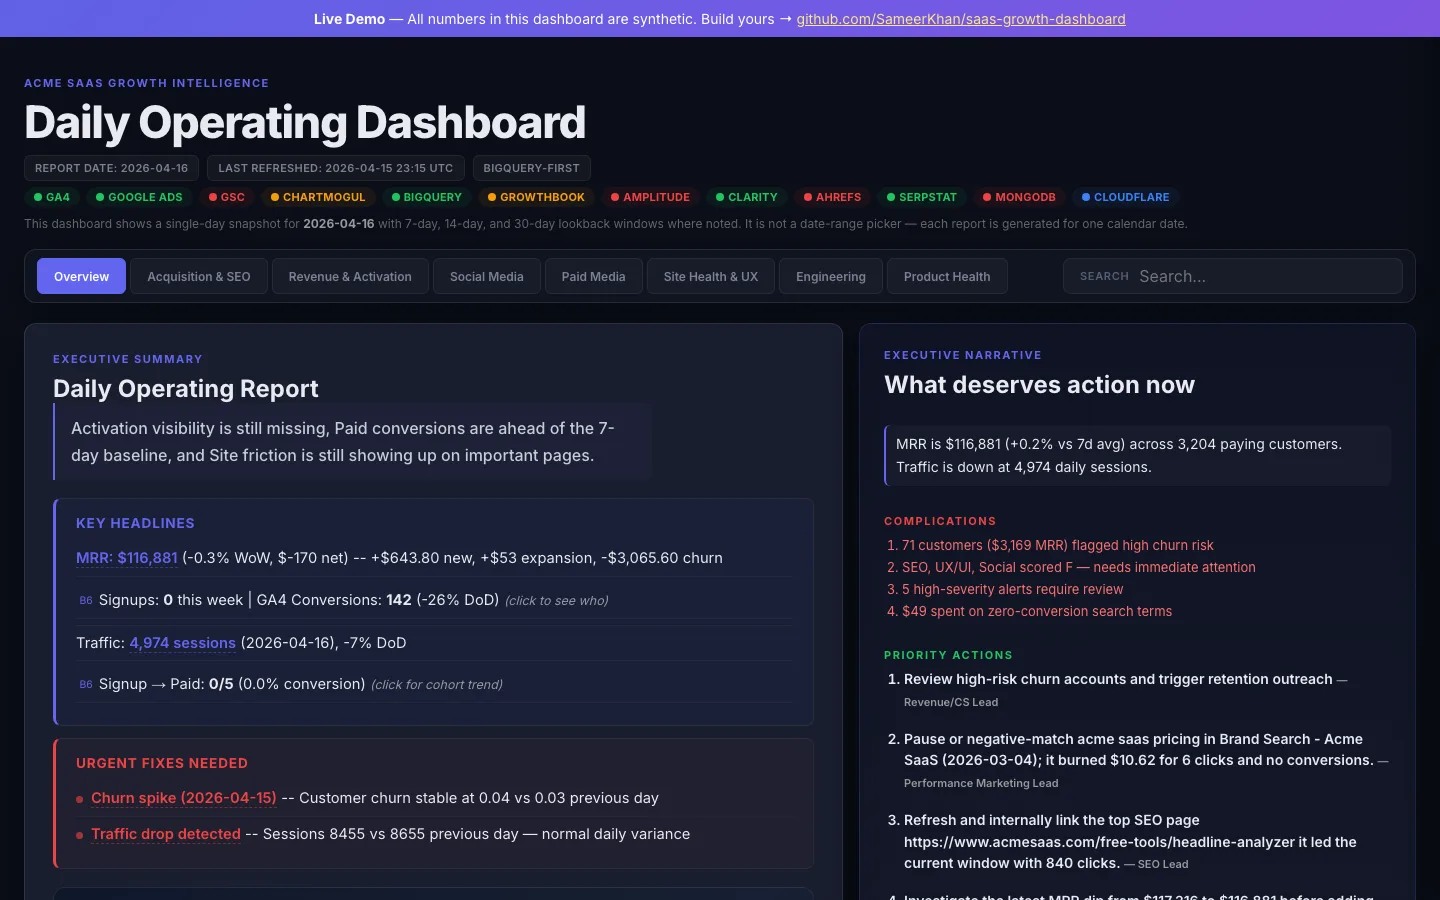
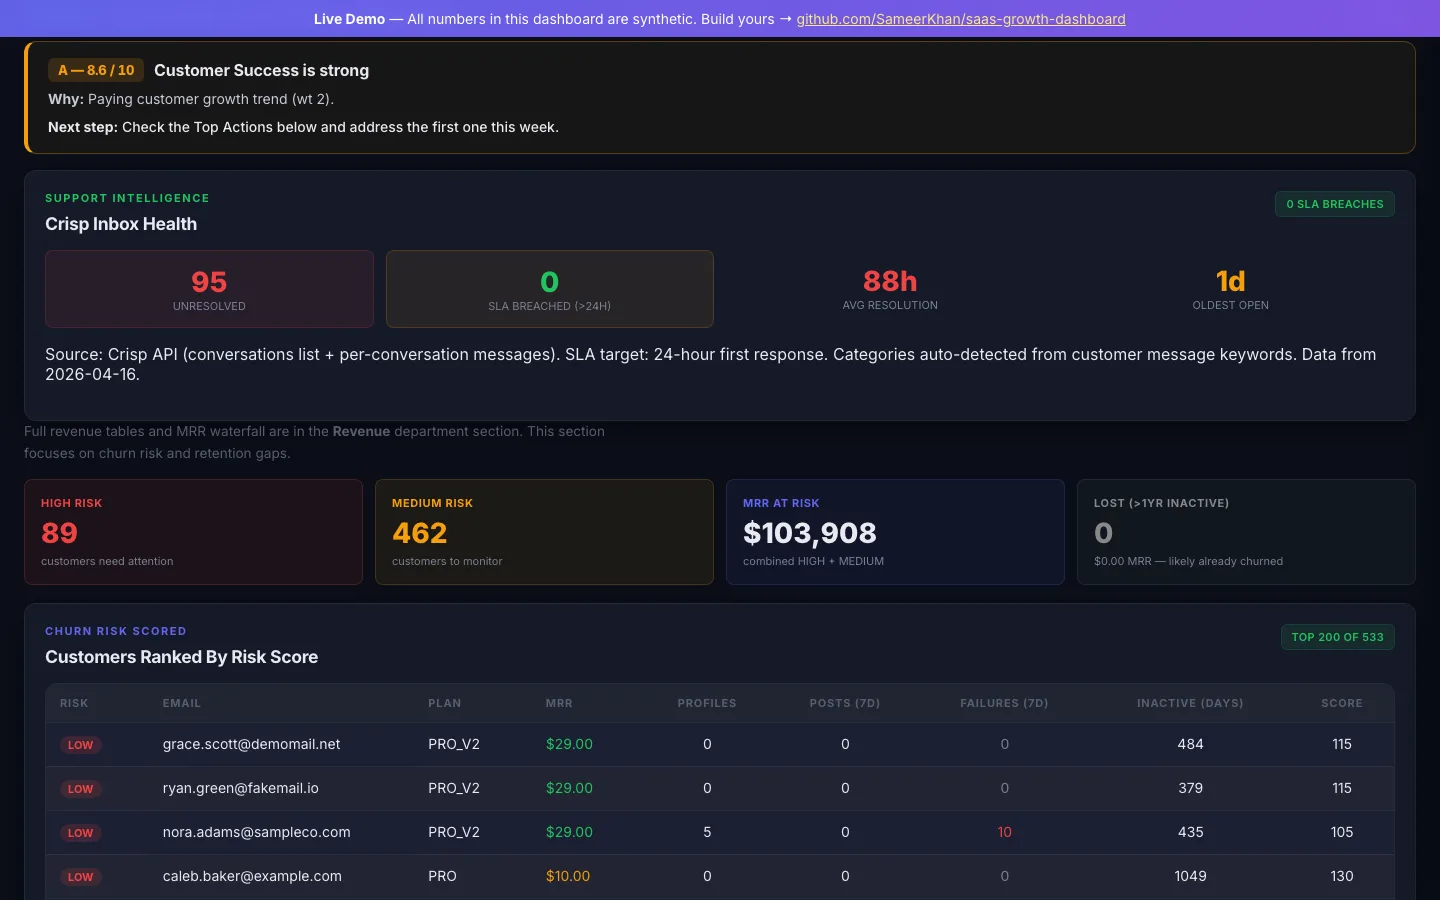
Every number in these screenshots is synthetic demo data from the public repository, not Social Champ’s.
What does the SaaS growth dashboard actually do?
The SaaS growth dashboard pulls data from 29 separate business tools into BigQuery, models it into 36 views, and renders a single HTML page with colour-coded KPIs and a prioritised list of what needs attention. It replaced the eight-tab ritual entirely, and our daily standup went from twenty minutes of “let me pull that up” to one page nobody has to prepare.
I did not set out to build a platform. I wanted to see Google Analytics and Google Ads next to each other, because I could not answer a question that felt like it should be easy: which blog post brought in the signup that turned into a paying customer.
So I connected two sources. Then ChartMogul, because traffic without revenue is a vanity chart. Then Amplitude, because revenue without activation tells you nothing about next month. Then Ahrefs, MongoDB, Crisp, ClickUp, GitLab, Meta Ads, Bing Ads, YouTube, Reddit, Clarity, Lighthouse, GrowthBook, Serpstat, Screaming Frog, Stripe.
That is the part I would warn you about. There is no natural stopping point. Two months after the first connector I had 29 of them, and every source you add makes the next missing one more obvious.
Why not just buy a dashboard tool?
Buying one does not solve the actual problem, which is that off-the-shelf dashboards model your business the way the vendor imagined it rather than the way it works. The hard part was never charting. The hard part was deciding what a number means at our company.
Take churn. Our raw churn rate looked worse than reality for a year, because a meaningful share of the customers we counted as churned came back within weeks. When I finally matched them cohort by cohort, about 27% of them reactivated. Their card had failed. That is not a customer leaving, that is a payment retry. Until you decide that in code, no tool can decide it for you, and every dashboard you buy will confidently show you the wrong number in a nice font.
Same with signups. We spent a long time reporting a number that turned out to be counting channels rather than accounts, which overstated it by roughly 1.6 times. Nobody lied. The word “user” just meant two different things in two different systems, and the dashboard was the thing that finally forced us to pick one.
In the version I published in August 2026, Sameer Ahmed Khan’s growth engine ships 29 source connectors and 36 modeled views across roughly 31,000 lines of Python, and stores everything in BigQuery at a cost of $0 to $5 a month for most SaaS companies at this data volume.
That last number surprises people. BigQuery sounds enterprise. For a company our size the whole warehouse costs less than one lunch, because you are storing rows of daily aggregates, not raw event firehoses.
The part I did not expect
The best thing about it is not the page. It is that I can ask it questions.
Everything runs through MCP, the same way the rest of my stack does, so Claude Code or Codex can reach the whole business the same way it reaches my repositories. I type “run the daily CEO report” and get an executive brief in three paragraphs. I ask which campaign is burning money on keywords that never convert and it goes and looks, across sources that used to live in four different browser tabs.
That changed how I work more than the dashboard did. I stopped reading numbers and started interrogating them. When you can ask a follow-up question in ten seconds instead of ten minutes, you ask the second and third question you would previously have skipped, and the third one is usually where the actual answer is.
It is the same pattern I keep running into everywhere this year. Two nights of prompts modernising a stack we had postponed for a decade. Two AI models reviewing each other’s work and catching what one alone would miss. The work was always possible. It was just never worth the number of evenings it used to cost.
And I have written before about what that pace did to me, so take the enthusiasm with the appropriate warning attached.
Take it
The repository is at github.com/SameerKhan/saas-growth-dashboard, MIT licensed, public since April 2026, with the full engine pushed in June. There are nineteen more screenshots and a walkthrough video in the docs folder if you want to see every panel before cloning anything.
Connect what you have and skip what you do not. Start with GA4 and one revenue source. The connectors are independent, so a missing API key disables one panel rather than breaking the run. The MongoDB connectors are written against Social Champ’s schema and are best read as reference adapters, with collection names remappable in the config.
Every founder I know is running their company off a spreadsheet somebody fills in by hand every Monday, or off eight tabs and a good memory. You deserve to know what is actually happening in your business without performing a small ritual every morning to find out.
If you want the rest of what I have been building and breaking this year, it is all in my writing.
Questions people ask
What data sources does the dashboard support?
The engine ships 29 connector modules as of August 2026. Acquisition and analytics: GA4, Google Ads, Bing Ads, Meta, Meta Ads, Amplitude, Amplitude users, Clarity. Search: Search Console, Ahrefs, Serpstat, Screaming Frog, Lighthouse, a blog sitemap crawler, rank movers. Revenue: ChartMogul, Stripe billing, churn risk. Product and ops: four MongoDB adapters covering accounts, feature activation, product health and product signals, plus product anomalies, GrowthBook, Crisp, ClickUp commitments and engineering. Community: YouTube and Reddit. A handful of those, churn risk, rank movers, product anomalies and engineering, are derived signals computed from the others rather than external APIs.
How much does it cost to run?
BigQuery storage and queries run between $0 and $5 a month for most SaaS companies at this volume, because the warehouse holds daily aggregates rather than raw event streams. The rest of the cost is whatever the source tools already cost you. The dashboard itself is free and MIT licensed.
Do I need all 29 sources to use it?
No. Connectors are independent and import-guarded, so a missing credential disables that panel instead of failing the run. Sameer Ahmed Khan recommends starting with GA4 plus one revenue source, then adding sources as the questions get more specific.
Does it work with Claude Code or Cursor?
Yes. The dashboard exposes its data through MCP, so any MCP-compatible agent including Claude Code, Codex and Cursor can query it in natural language. Asking for the daily CEO report returns a written executive brief rather than a chart you still have to interpret.
Is this the same dashboard Social Champ runs internally?
The open-source repository contains the same engine, with company-specific configuration moved into a config file and internal-only panels removed. Social Champ’s production workspace stays the source of truth, and changes are ported outward, which is why the public repo carries the full engine rather than a stripped demo.